The Internet is in constant change so needless to say Internet statistics may differ from each other from one year to another.
Rather than leave you with old or irrelevant data to reference and share, we regularly revisit and revise our list of Internet facts and hosting statistics.
In the following Internet Stats & Facts for 2021, we’ve rounded up all the important data related to:
- The Internet
- The mobile web
- Domain names
- Web hosting and websites
- Web search
- Online advertising
- E-commerce
- Social media
Internet Statistics 2021
1. There are 7.83 billion people in the world. (Worldometer), 4.66 billion of them are active Internet users. (Statista)
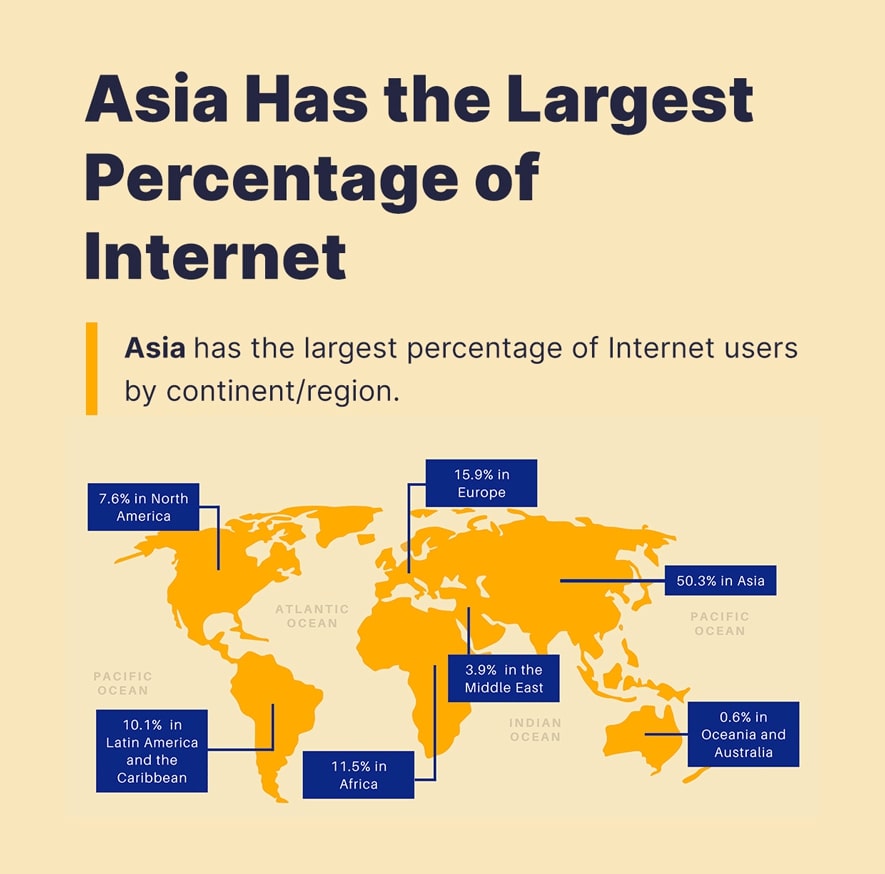
2. Asia has the largest percentage of Internet users by continent/region. Of all people using the Internet:
- 51.8% are in Asia
- 14.8% are in Europe
- 12.8% are in Africa
- 9.5% are in Latin America and the Caribbean
- 6.8% are in North America
- 3.7% are in the Middle East
- 0.6% are in Oceania and Australia
3. Kuwait is the country with the highest penetration of Internet users, with 99.6%. (Internet World Stats)
6. The United States has the third-highest number of Internet users by country, with 284 million. (Statista)
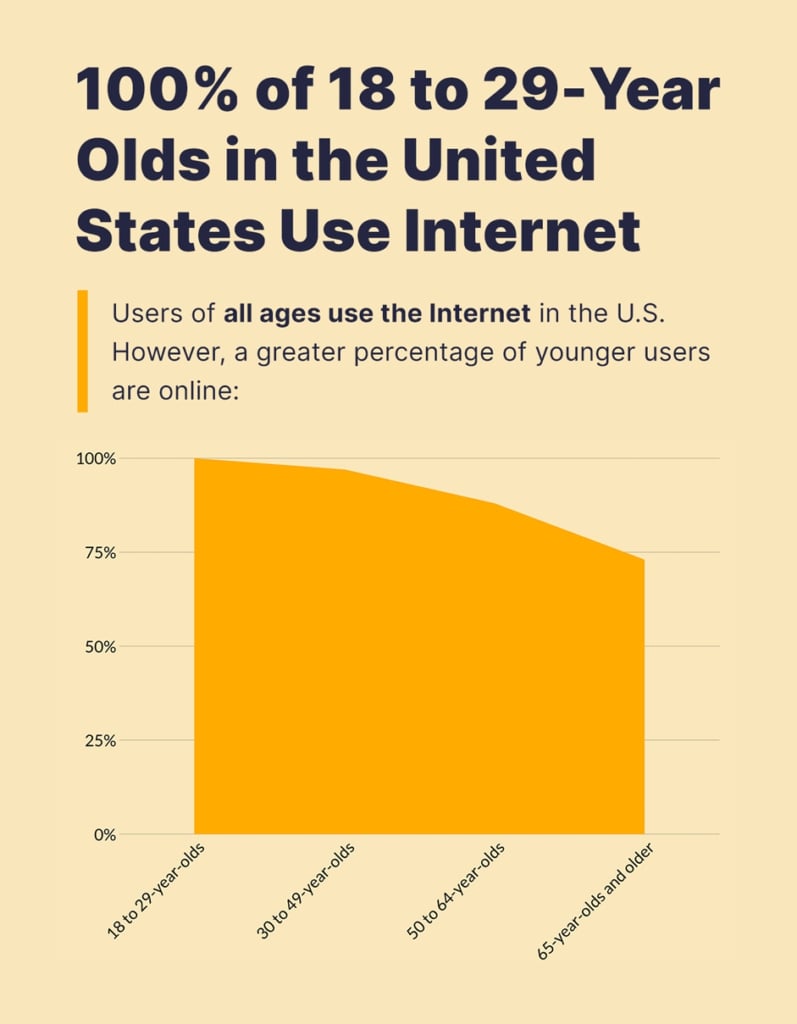
7. One of the Internet facts I find most amazing is that users of all ages use the Internet in the U.S. However, a greater percentage of younger users are online:
- 100% of 18- to 29-year-olds
- 97% of 30- to 49-year-olds
- 88% of 50- to 64-year-olds
- 73% of 65-year-olds and older
(Statista)
8. More users access the Internet with a Chrome browser (63.54%) than any other browser. (statcounter)
9. More users access the Internet with an Android device (38.83%) than any other desktop or mobile device. (statcounter)
10. The average Internet user spends 6 hours and 58 minutes online every day. (GWI)
11. For every second of the day, there are 6.59 billion GB of Internet traffic. (Internet live stats)
12. The average Internet connection speed is 24.8 Mbps. (World Economic Forum, 2020)
Mobile Internet Statistics and Facts 2021
13. There are 4.28 billion mobile Internet users. (Statista)
14. Over half of all Google search visits (56%) take place on a mobile device. (Statista)
15. On average, there are 56.8 exabytes of mobile traffic every month. (Statista)
16. 42.73 petabytes of that monthly traffic comes from video. (Statista)
17. The average mobile Internet connection speed is 20.4 Mbps. (Statista)
18. In the U.S., the average adult spends an average of 4 hours 1 minute on mobile Internet every day. (eMarketer)
19. Here’s another mobile Internet fact that might interest you: 89.2% of mobile Internet time is spent on mobile apps. (eMarketer)
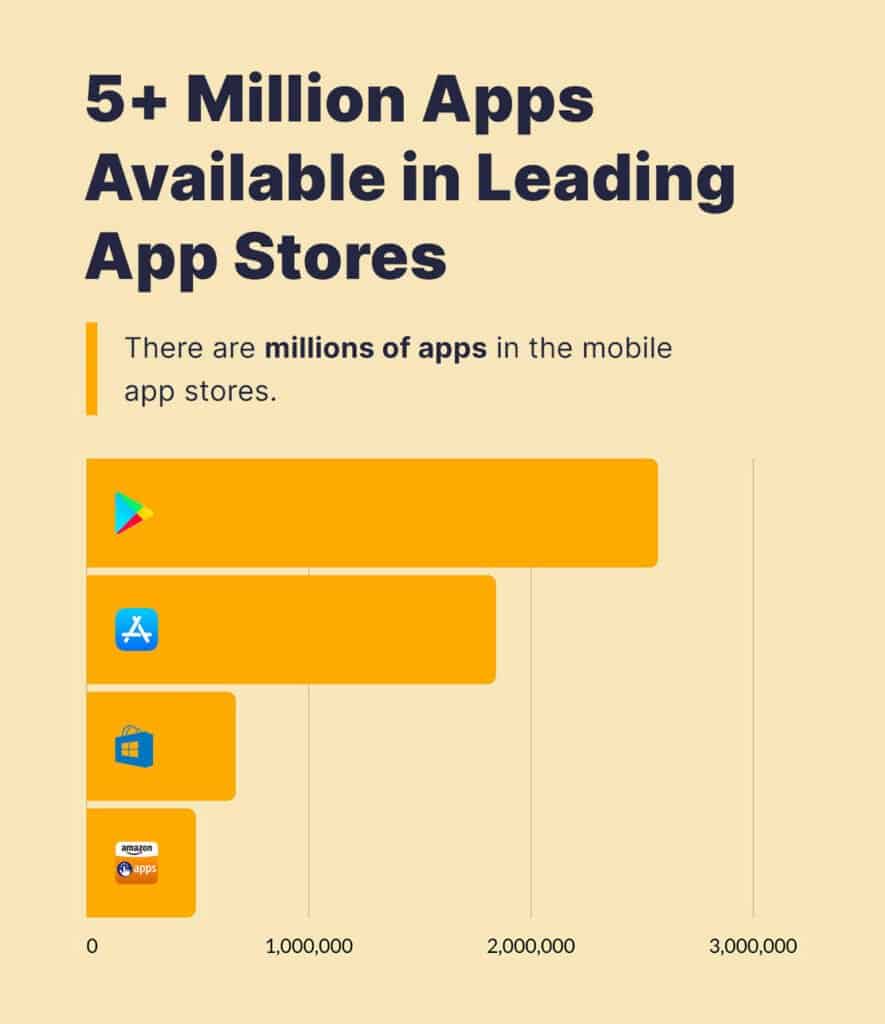
20. There are millions of apps in mobile app stores:
- 2,870,000 in Google Play Store
- 1,960,000 in Apple App Store
- 669,000 in Windows Store
- 450,000 in Amazon Appstore
(Statista)
21. In 2021 alone, there will be an estimated 196 billion mobile app downloads on the Google Play Store. (Statista)
22. 25% of these apps would only be used once though. (Statista)
23. It’s estimated that mobile apps will generate $693 billion worldwide in 2021. (Statista)
Domain Name Statistics 2021
24. The first domain name was symbolics.com, registered in 1985. (Wikipedia)
25. The most expensive domain name sold (that was publicly reported) was Voice.com for $30 million. (Wikipedia)
26. There are 370.7 million registered domain names. (VeriSign Domain Name Industry Brief Q3 2020)
27. The most popular top-level domain (TLD) is .com with 150.3 million. (VeriSign Domain Name Industry Brief Q3 2020)
28. There are in total 160.6 million registered country code TLD (ccTLD). (VeriSign Domain Name Industry Brief Q3 2020)
29. The fastest-growing general TLD (gTLD) is .icu, which 4,337,102 registered domains in use. (NameStat)
Web Hosting/Website Statistics and Facts 2021
30. Tim Berners-Lee created the first web server (called CERN HTTPd) and the first website at https://info.cern.ch/. (Wikipedia)
31. The 3 most popular web hosting companies are:
(W3Techs)
32. The United States is home to more web servers than any other country, with 39.7%. (W3Techs)
33. There are 1.82 billion websites. (Internet Live Stats)
34. 68.2% of all websites use HTTPS. (W3Techs)
35. 49.6% of all websites use HTTP/2. (W3Techs)
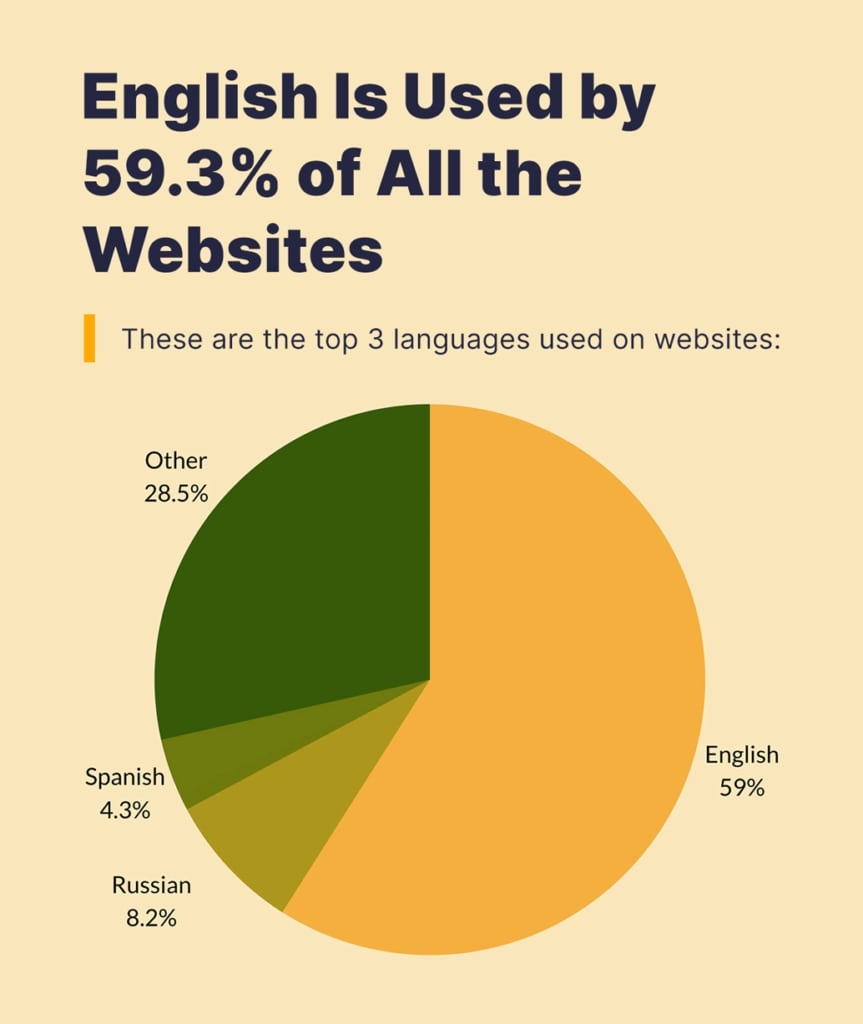
36. These are the top 3 languages used on websites:
- English: 60.5%
- Russian: 8.6%
- Spanish: 4.0%
(W3Techs)
37. The average transfer size of a website is:
- Desktop: 2,062.4 KB
- Mobile: 1,891.6 KB
38. The average mobile page takes 9.3 seconds to load (until interactive). (HTTP Archive)
39. Mobile visitors are 123% more likely to bounce from a mobile website if it takes 10 seconds to load (as opposed to 1 second). (Think with Google)
40. WordPress is the leading content management system with 63.9% market share and 39.3% of all websites built with it. (W3Techs)
Web Search Statistics 2021
41. Google holds the majority market share of all search engine activity, with 92.16%. (statcounter)
42. Bing is the second most popular search engine in the world with a measly market share of 2.88%. (statcounter)
43. 68% of all website traffic comes from search engines. (Smart Insights)
44. Google receives about 7 billion search queries every day. (Internet Live Stats)
45. Google has indexed hundreds of billions of web pages. It is estimated that the Google Search Index contains over 100,000,000 gigabytes of data. (Google)
46. Google now indexes all websites using a mobile-first algorithm. (Google Developers)
47. More than half (50.33%) of all Google searches result in zero clicks. (SparkToro)
Internet Advertising Trends 2021
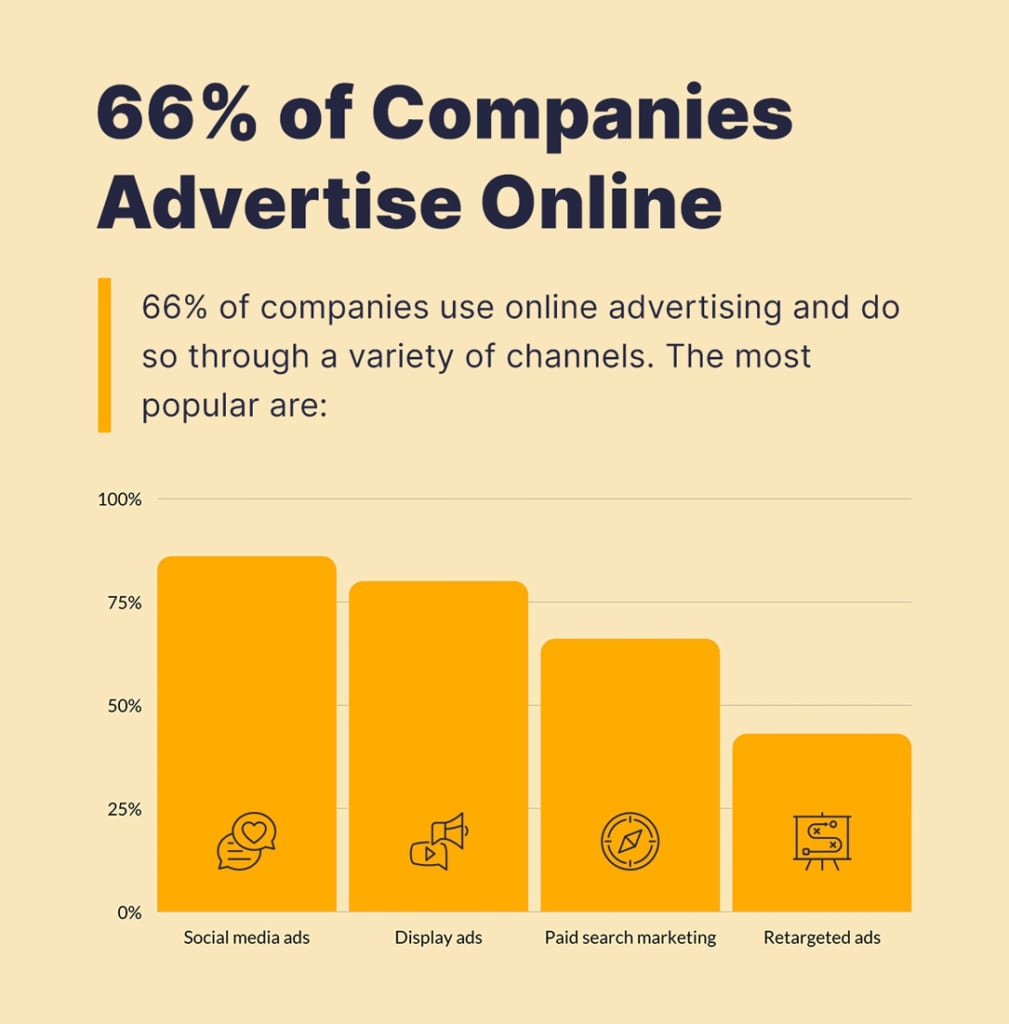
48. 66% of companies use online advertising and do so through a variety of channels. The most popular are:
- Social media ads: 86%
- Display ads: 80%
- Paid search marketing: 66%
- Retargeted ads: 43%
49. The greatest share of ad spend (for all media) goes to the following:
- Television: 29%
- Paid search: 17%
- Social media: 13%
50. Global ad spending dropped 9.1% in 2020 due to the coronavirus pandemic. (Zenith Media)
51. Global ad spend is expected to recover and grow by 5.8% in 2021. (Zenith Media)
52. 6.85% of all Google desktop search clicks and 11.38% of mobile search clicks are on paid ads. (SparkToro/Jumpshot)
53. 20.3% of consumers have never purchased anything after seeing an ad for it in search or on social media. (Statista)
54. More commonly, 37.9% of consumers will buy something a quarter of the time that they see an ad. (Statista)
55. 47% of Internet users use an ad blocker. Here’s the geographic breakdown:
- APAC: 40%
- North America: 38%
- MEA: 37%
- Europe: 36%
- Latin America: 35%
(GlobalWebIndex Global Ad-Blocking Behavior infographic)
56. The top 3 reasons consumers give for using ad blockers are:
- Too many ads: 48%
- Ads are annoying or irrelevant: 47%
- Ads are too intrusive: 44%
(GlobalWebIndex Global Ad-Blocking Behavior infographic)
57. U.S. businesses lost an estimated $12.12 billion due to ad blocking in 2020. (Statista)
E-Commerce Statistics 2021
58. An estimated 2.14 billion people will shop online in 2021. (Statista)
59. 47% of all purchases are done online. (Think with Google)
60. In Q2 2020, 31% of online sales took place on mobile devices. (comScore State of Retail)
61. Worldwide retail eCommerce sales is projected to reach $4.88 trillion in 2021. (Statista)
62. Retail eCommerce sales is projected to grow to 6.54 trillion US dollars in 2022. (Statista)
63. Amazon alone sold $275.86 billion in goods in 2019. $160 billion of it came from marketplace merchants. (Digital Commerce 360 2019 eCommerce in review report)
64. 83% of U.S. consumers leveraged data from e-commerce websites to inform their retail shopping experiences. (Think with Google)
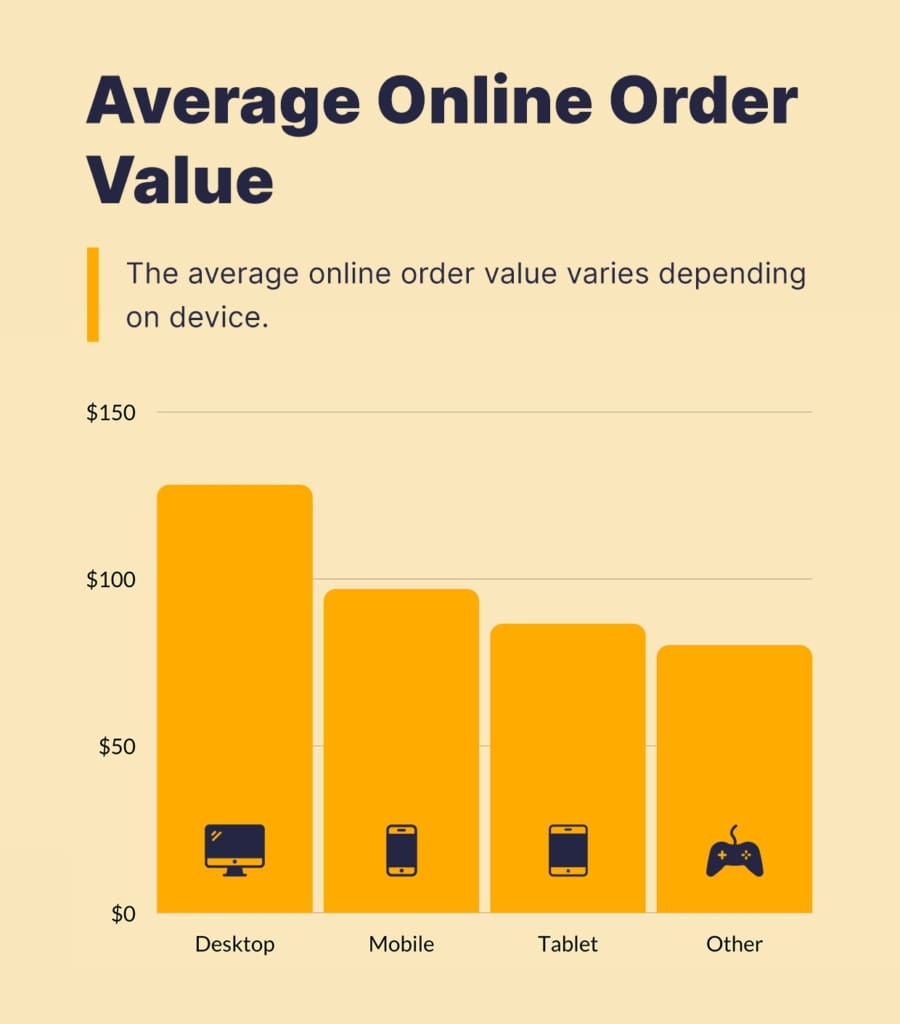
65. The average online order value varies depending on the device:
- Desktop: $179.98
- Tablet: $87.01
- Smartphone: $79.33
- Other: $70.95
(growcode)
66. 50% of consumers say free shipping is the #1 factor when deciding whether to make a purchase. (comScore State of Retail)
Social Media Statistics 2021
67. There are 4.14 billion active social media users around the globe. (Statista)
68. Consumers spend an average of 2 hours and 24 minutes every day on social media and messaging apps. (GlobalWebIndex Social Media Trends 2020)
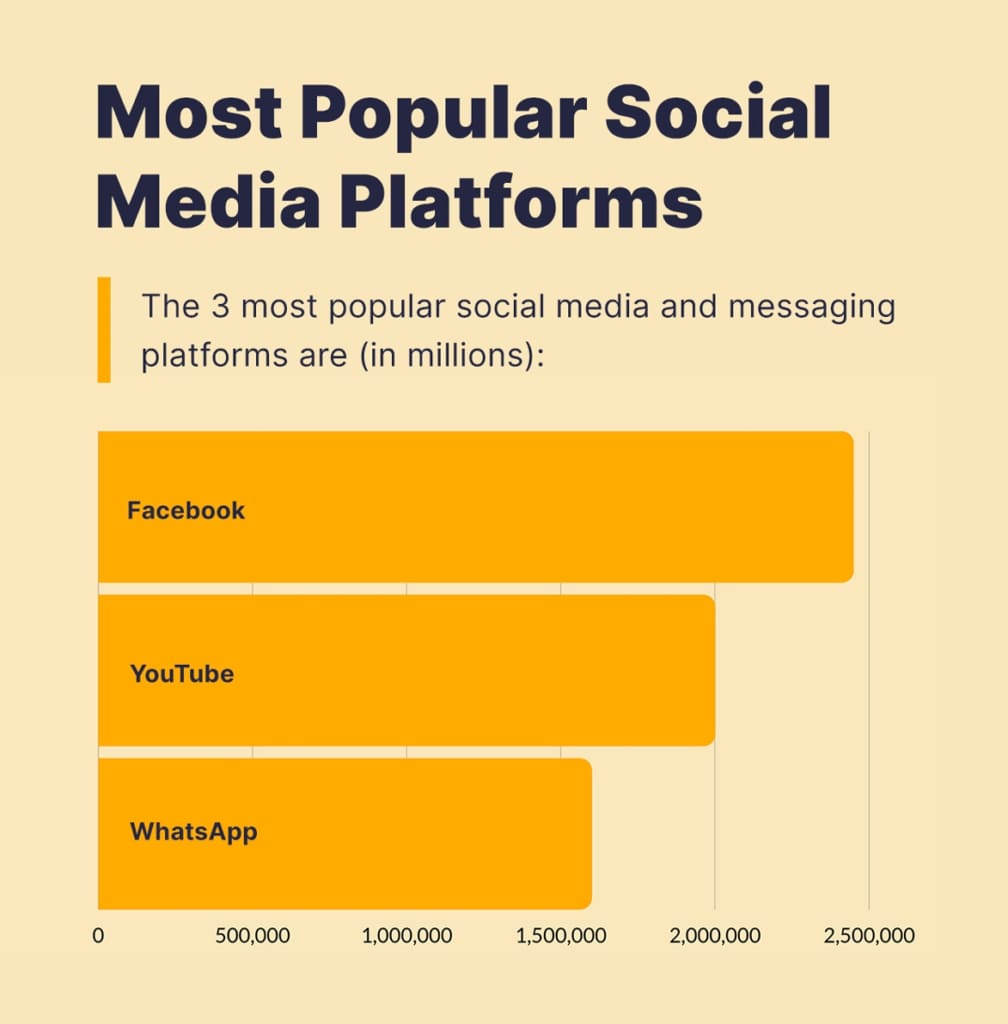
69. The 3 most popular social media and messaging platforms are (in millions):
- Facebook with 2,701,000 users
- YouTube with 2,000,000 users
- WhatsApp with 2,000,000 users
(Statista)
70. Although social media users usually are on more than one network, there’s a generational divide in how many they manage at one time:
- Millennials have the most with 8.1 accounts
- Gen Z has 7.9
- Gen X has 6.3
- Baby Boomers have 4.6
(GlobalWebIndex Social Media Trends 2020)
71. There are over 180 million businesses that use Facebook and its associated properties (i.e. Instagram, Messenger, etc.) every month. (Facebook)
72. Over 100 billion messages are sent and 1 billion stories are shared through Facebook products every day. (Facebook)
73. 70% of the time spent on YouTube is through users’ mobile devices. (YouTube)
74. 60% of Instagram users have discovered new products there. (Instagram)
75. Over 200 million Instagram users will visit at least one business profile every day. (Instagram)
76. People most commonly use social media in the following ways when shopping:
- Do research on products they’re interested in (43%)
- Learn about brands and products from ads (27%)
- Get recommendations from their connections (24%)
(GlobalWebIndex Social Media Trends 2020)
77. 40% of Americans have bought something they found on social media. (Mint)
78. 26 percent of shoppers rely on social media for help with holiday shopping. (Statista)
79. Mobile devices are responsible for over 95 percent of Facebook ad clicks. (Merkle Digital Marketing Report, Q1 2020)
What Do You Think About the Above Internet Facts and Stats?
You find the above Internet statistics amazing, don’t you?
Nowadays, you can’t imagine a world without the Internet. We use it for almost everything we do.
It is reported that by 2021 the percentage of people going online will grow to be 53.7%. The continuous increase of Internet users will also mean that technology will go through innovations, creating new opportunities and benefits of accessing the Internet.
To think that there were hardly any social media platforms and no smartphones available 15 years ago, what will the next 15 years bring?
It is hard to predict how the future of the online world will look exactly but one thing is for sure – the Internet era has only just begun.